


Preview: Operator & switchboard statistics report
This proposed report presents aggregated call data, broken down into hourly intervals. Data is compiled across the selected date range (e.g. day, week, or month) and can be generated for individual operator / switchboard extensions, or for an entire team if preferred.
If you would find this report helpful, please hit the Like button further down the page.
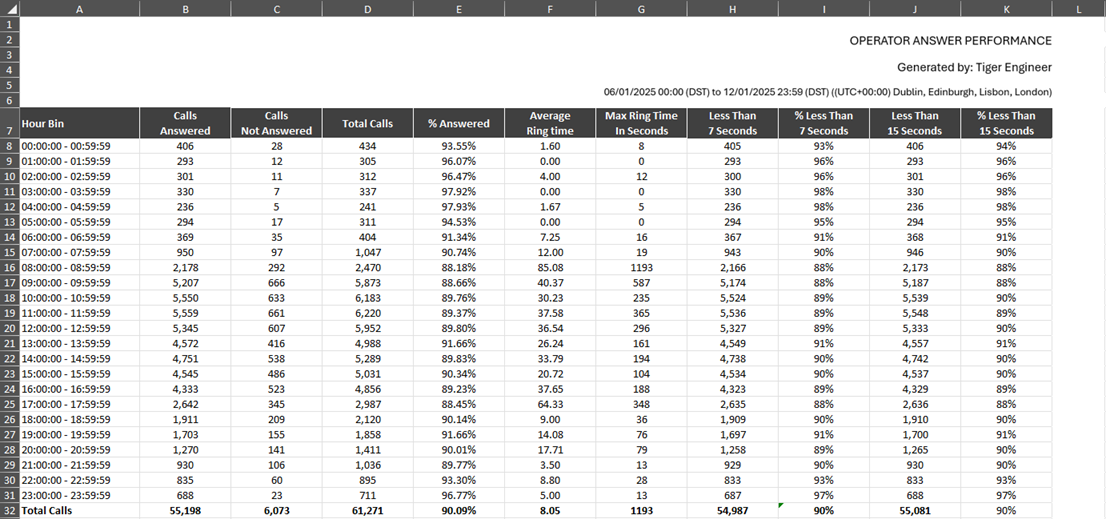
Within each hour bin row it could provide you:
- Calls answered (Volume)
- Calls not answered (Volume)
- Total calls (Calls received)
- % of answered calls
- Average ring time
- Max ring time in seconds
- Answered in less that X seconds
- % answered in less that X seconds
- Totals for the period are presented at the bottom
- There is also a graph to provide a visual indication of average and maximum Ring times/Queue times
Is this report helpful?
There may be configurable aspects of this report depending on your telephony system. For instance, presenting ring time / queue time / response time or the ability to set bespoke targets.
If there are additional fields or data points you believe would enhance the report, we’d love to hear from you! Please reach out to our Customer Success Team to discuss your suggestions.
If you find this report helpful, don’t forget to click the like button below!